


THE US FEDERAL DEFICITS AND DEBT: Moving towards a Fix - US Federal Spending and Tax Revenues
Article #7 Purple Wayz: Navigating to the Center

OK. After reading about the boiling frog situation, you now have a healthy respect for the dangers of ongoing large deficits. The debt is around 100% of GDP now–the goal is to keep it there or lower it. We need to turn down the heat! Importantly, this doesn’t mean we have to eradicate deficits. WE JUST HAVE TO GROW THE DEBT SLOWER THAN THE GROWTH OF GDP! This is doable, people! One step at a time.
Of course, we all know that the Debt/GDP ratio will be higher than 100% by 2028 given what we know so far about Trump’s plans, and the recent news about October and November deficits. So maybe a more reasonable goal is under 110% by 2035 or so. And headed oh-so-slowly downward after that. Spoiler: We’ll need to find $1T of savings, in the form of lower spending and/or higher tax revenues, in 2024 dollars. And we’ll need to commit to growing from there slower than GDP. While that probably seems a huge order, it’s doable.
Let's dive into the major components of the federal budget.
Breakdown of the US Federal Budget: Spending & Tax Revenues
Spending: For a high level look, we review the 3 main areas of spending: Mandatory, Discretionary, and Interest Expense. Mandatory has been the fastest growing, as you can see in this chart from the Tax Policy Center. Interest Expense is likely to grow fastest in the coming years as the debt piles up and rates are higher.

Mandatory–aka Entitlement–Programs (66% in 2022):
Social Security: Provides benefits to retired and disabled workers.
Medicare: Health insurance for people aged 65 and older, and some younger people with disabilities.
Medicaid: Health insurance for low-income individuals and families.
Supplemental Income: programs such as unemployment compensation, Supplemental Nutrition Assistance Program (SNAP), refundable tax credits. These programs together are also known as Welfare.
Discretionary Spending (26%): This is the piece that can be most easily affected by the new Department of Governmental Efficiency (DOGE) that Donald Trump announced, headed by Elon Musk and Vivek Ramaswamy. This category covers a wide range of programs, including:
National Defense: Military spending, including salaries, equipment, and operations (12% of total spending–people are always surprised at how low this is).
Education: Funding for schools, colleges, and research programs.
Transportation: Infrastructure projects, including highways, airports, and public transit.
Other Programs: A variety of areas such as environmental protection, scientific research, law enforcement, and foreign aid.
Net Interest (8%): Interest payments on the national debt.
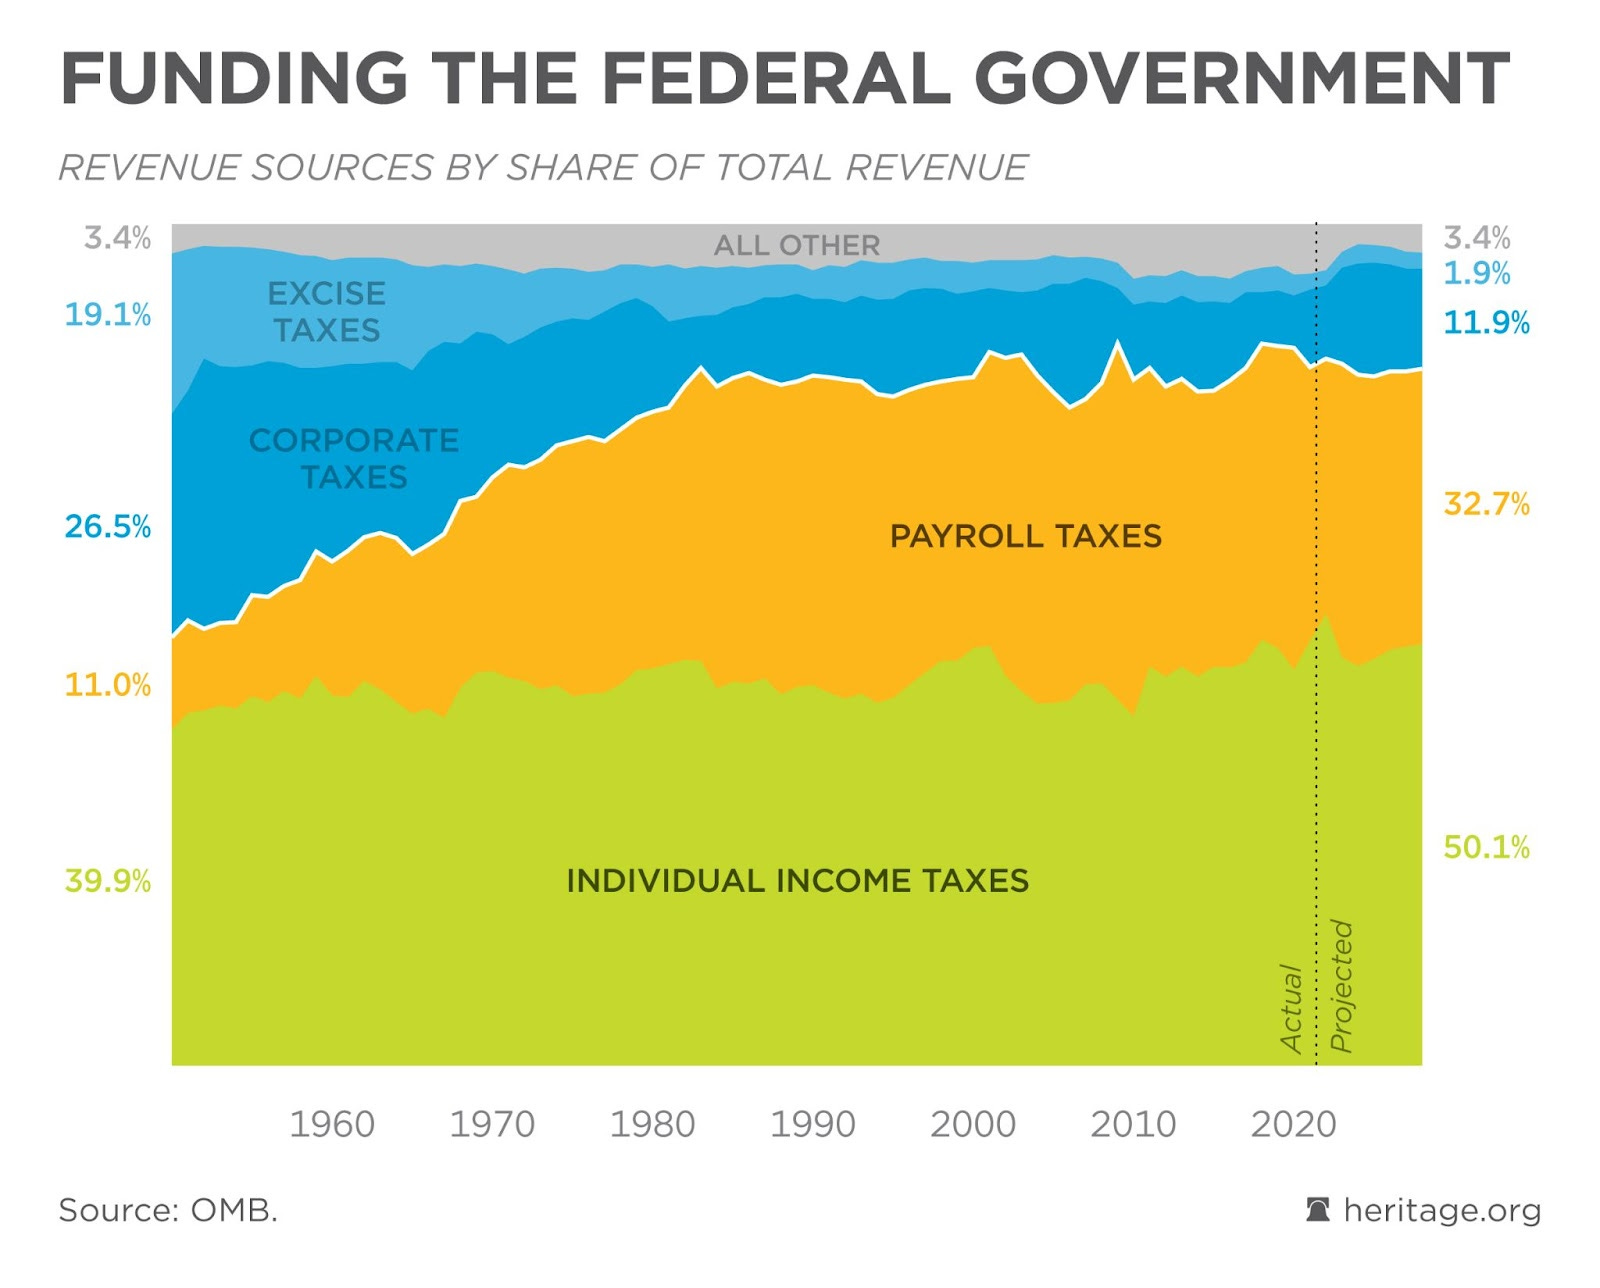
Tax Revenues: The federal government collects revenue from various sources, with the major ones being:
Individual Income Taxes (50%): Taxes paid by individuals on their earnings.
Payroll Taxes (33%): Taxes collected to fund Social Security and Medicare.
Corporate Income Taxes (12%): Taxes paid by businesses on their profits.
Other Taxes (5%): Includes excise taxes, estate taxes, and customs duties.
The chart below shows the trending of these categories over time. You can see that, since the 1980s, the US has become heavily dependent on Payroll and Individual Income taxes.
This chart below is a snapshot from 2023 that shows tax revenues up against spending. The difference is the Deficit. In 2023, the US Federal Deficit was $1.7 Trillion, or 6.0% of GDP that year.
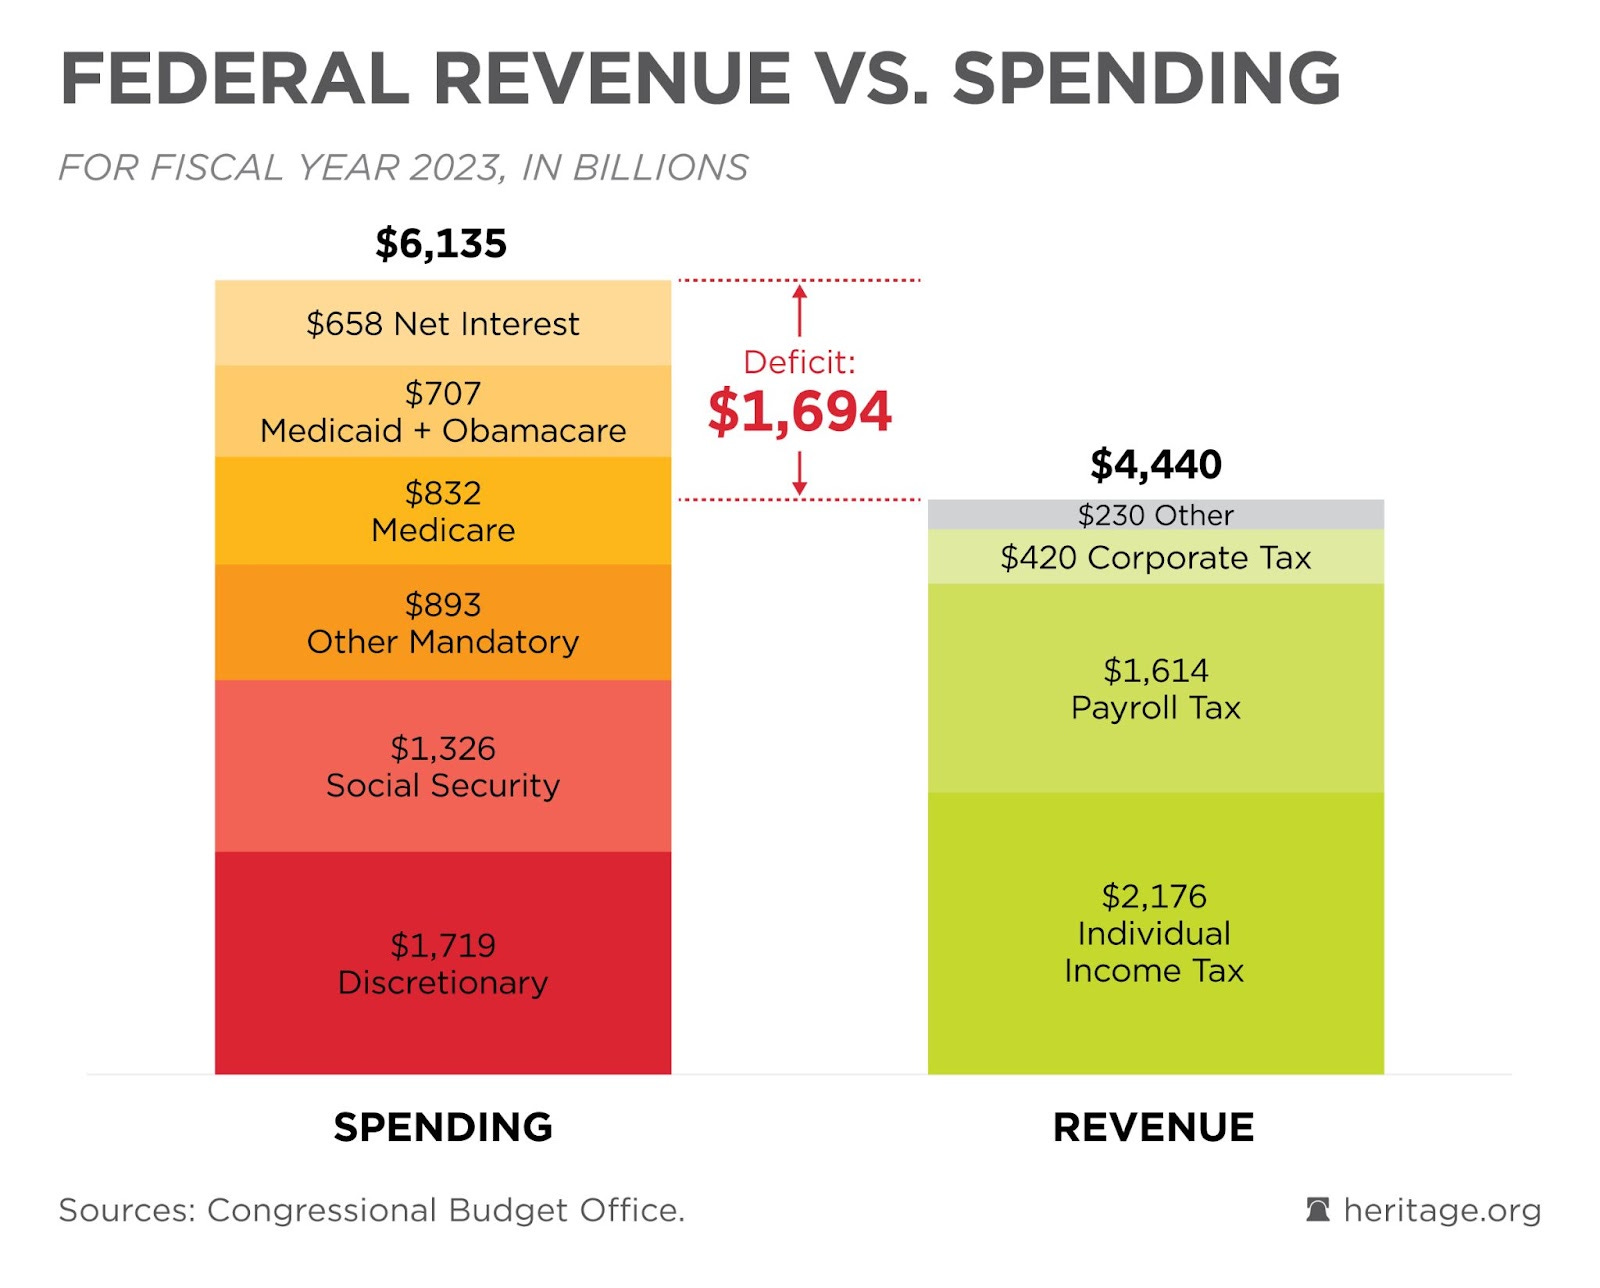
This level of deficit grows the debt faster than GDP, which has been growing at a long term average in the low 2% range. Why is it so hard to fix? In the next article, we’ll explore the proposal and failure of the most recent legitimate chance we had to attack this: The Simpson Bowles Fiscal Commission of 2010.
Excellent